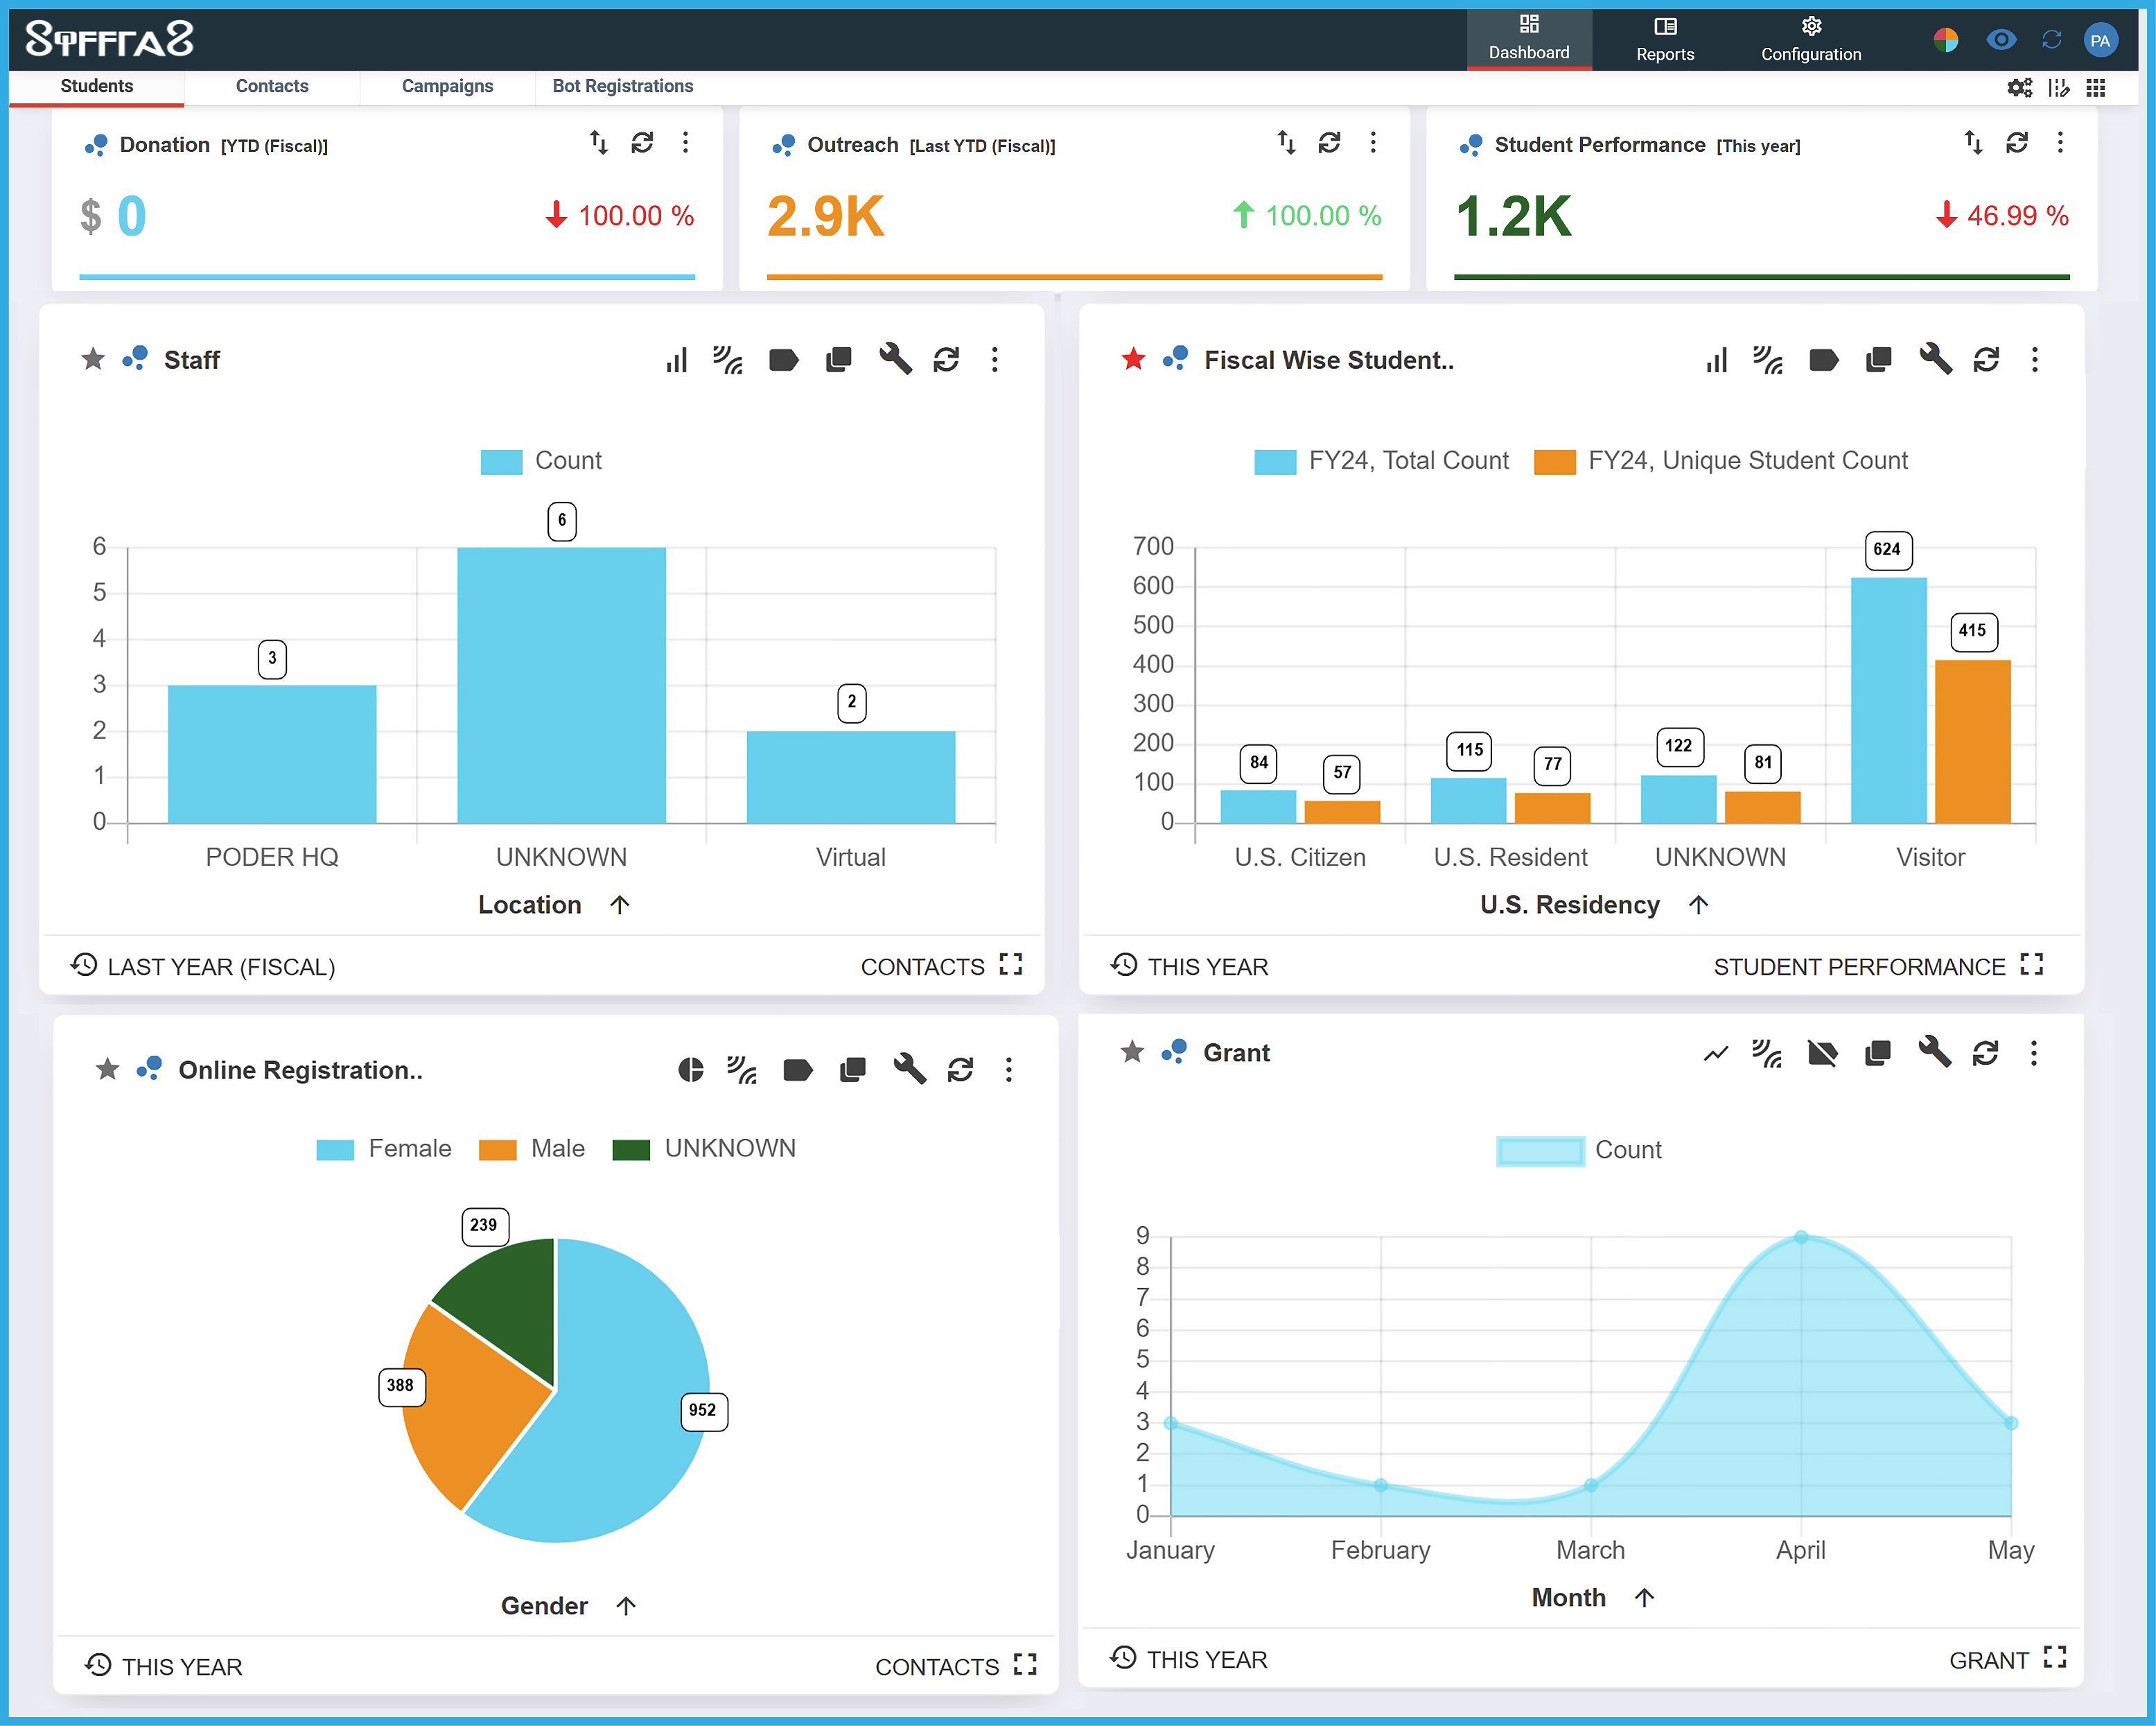
Siffras provides an easier, more effective way to collect your data complete your IPEDS surveys, so you can focus on more strategic initiatives that support your institution's goals. This web-based, user-friendly platform offers Ready-To-Go Dashboards, Data Visualizations, and Dynamic Reports pre-configured with the institutions specific data needed to complete and accurately submit all IPEDS reporting surveys.
In the ever-evolving world of higher education, time is of the essence. Siffras provides near real-time dashboards and reporting, allowing you to make informed decisions swiftly and confidently. Siffras offers a simpler, quicker way to run reports and visualize data, making your job easier.
Dashboards show summarized data quickly, simply, and graphically to users throughout your institution. The interactive charting module adds visualizations such as gauges, pie charts, bar graphs, line plots, and more to your dashboards. Charts can be made interactive, allowing users to drill down into the data for a more detailed analysis.
User-friendly interface for creating reports and dynamic visualizations, accessible to all users of all backgrounds. An easier way for everyone to take charge of their data visualization and reporting needs.
With Siffras, there's no programming experience required, no need to wait for lengthy data draws from technical staff, and no precious time wasted on inefficient data aggregation and reporting.
Liberate the Office of Institutional Research, Assessment, and effectiveness to focus on complex data requests, while enabling administrators and staff to generate their own dashboards, charts, and reports.
Frees Up IT, No complex development or lengthy installation and easy maintenance.